Урок 17-18
Program a;
uses GraphABC;
var pic: integer;
begin
SetWindowSize (740, 620);
ClearWindow (clWhite);
pic:= LoadPicture ('Einstein.JPG');
DrawPicture (pic, 80, 30, 150, 180);
TextOut(100,210, 'Энштэйн');
pic:= LoadPicture('bohr.JPG');
DrawPicture (pic, 380, 70, 150, 180);
TextOut(390,250, 'Бор');
pic:= LoadPicture('Newton.JPG');
DrawPicture (pic, 380, 350, 150, 180);
TextOut(390,530, 'Ньютон');
pic:= LoadPicture('Leonardo.jpg');
DrawPicture (pic, 80, 390, 150, 180);
TextOut(100,570, 'Леонардо');
pic:= LoadPicture('Galileo.jpg');
DrawPicture (pic, 230, 210, 150, 180);
TextOut(240,390, 'Галилео');
end.

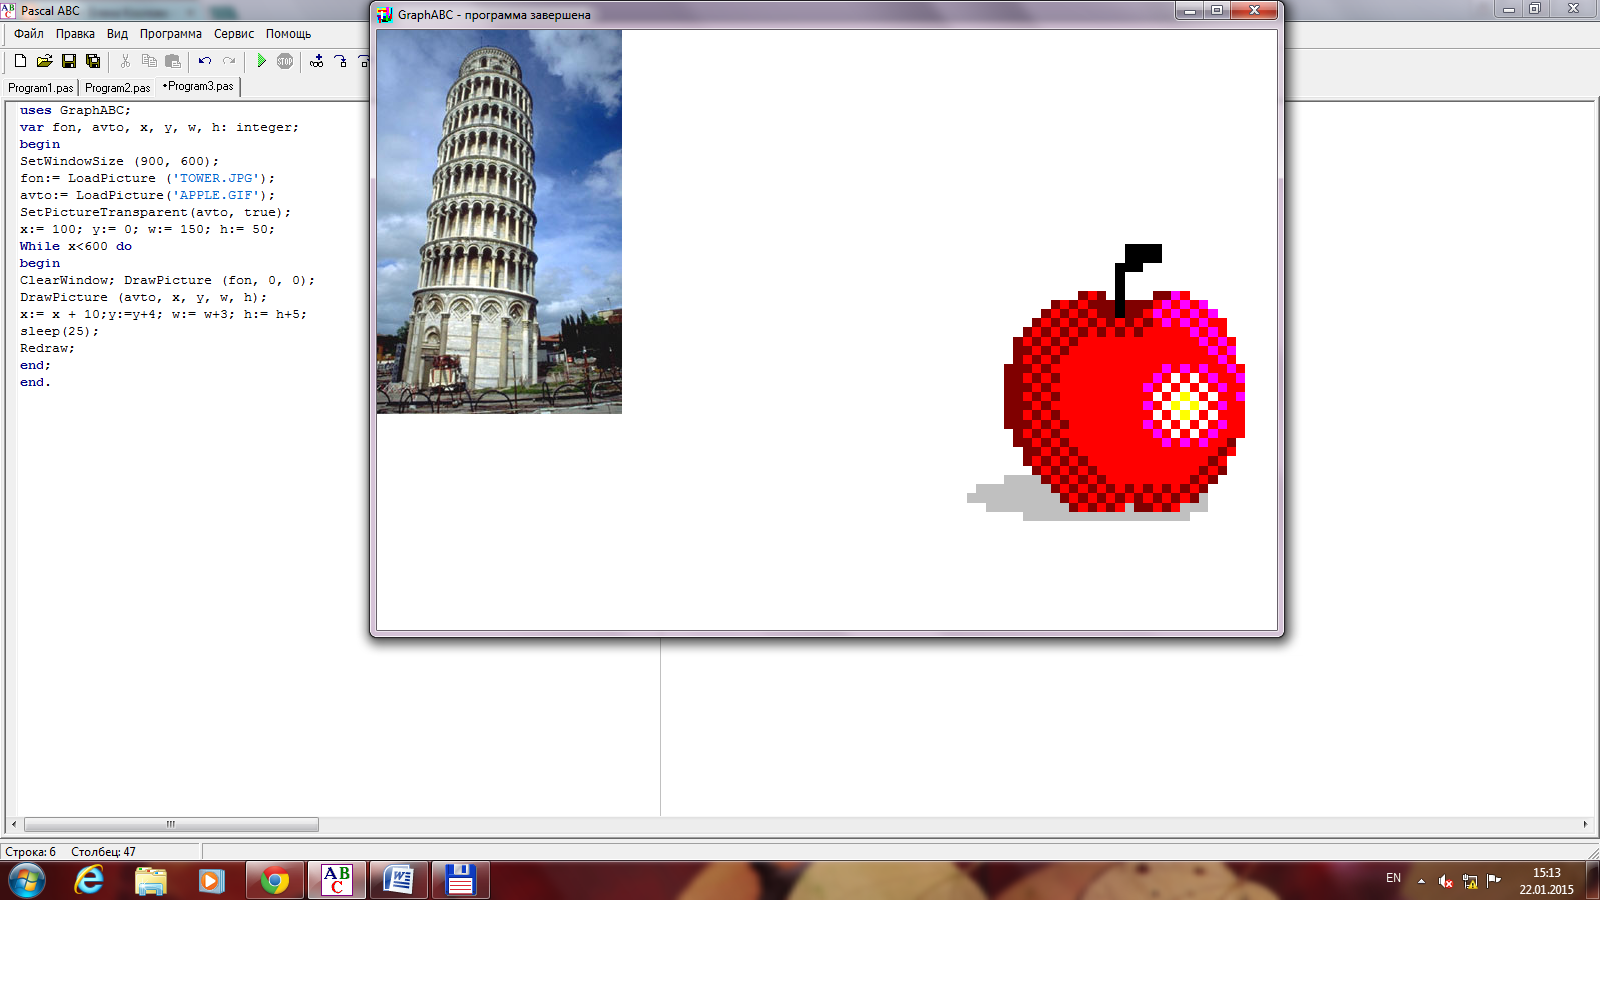
яблоко с башни
uses GraphABC;
var fon, avto, x, y, w, h: integer;
begin
SetWindowSize (900, 600);
fon:= LoadPicture ('TOWER.JPG');
avto:= LoadPicture('APPLE.GIF');
SetPictureTransparent(avto, true);
x:= 100; y:= 0; w:= 150; h:= 50;
While x<600 do
begin
ClearWindow; DrawPicture (fon, 0, 0);
DrawPicture (avto, x, y, w, h);
x:= x + 10;y:=y+4; w:= w+3; h:= h+5;
sleep(20);
Redraw;
end;
end.

Фигуры:
Квадрат
Program grey_1;
uses GraphABC;
begin
SetWindowWidth(700);
SetWindowHeight(700);
SetPenColor (clblack);
SetPenWidth(5);
Line(100,125,560,125);
Line(100,125,100,585);
Line(100,585,560,585);
Line(560,585,560,125);
floodfill (150,300,clblue);
end.
uses GraphABC;
begin
SetWindowWidth(700);
SetWindowHeight(700);
SetPenColor (clblack);
SetPenWidth(5);
Line(100,125,560,125);
Line(100,125,100,585);
Line(100,585,560,585);
Line(560,585,560,125);
floodfill (150,300,clblue);
end.

Прямоугольник
Program grey_2;
uses GraphABC;
begin
SetWindowWidth(700);
SetWindowHeight(700);
SetPenColor (clgreen);
SetPenWidth(5);
Line(100,125,570,125);
Line(100,125,100,400);
Line(100,400,570,400);
Line(570,400,570,125);
floodfill (150,300,clred);
end.

Параллелограмм

uses GraphABC;
begin
SetWindowWidth(700);
SetWindowHeight(700);
SetPenColor (clyellow);
SetPenWidth(5);
Line(225,125,340,125);
Line(225,125,170,300);
Line(170,300,285,300);
Line(285,300,340,125);
floodfill (230,200,clgray);
end.
Ромб

uses GraphABC;
begin
SetWindowWidth(700);
SetWindowHeight(700);
SetPenColor (clred);
SetPenWidth(5);
Line(225,125,180,300);
Line(225,125,270,300);
Line(270,300,225,475);
Line(180,300,225,475);
floodfill (200,300, clpurple);
end.

uses GraphABC;
begin
SetWindowWidth(700);
SetWindowHeight(700);
SetPenColor (clgreen);
SetPenWidth(5);
Line(225,125,500,125);
Line(225,125,100,300);
Line(100,300,625,300);
Line(625,300,500,125);
floodfill (500,250, clblack);
end.
Прямоугольная трапеция

Program grey_6;
uses GraphABC;
begin
SetWindowWidth(800);
SetWindowHeight(800);
SetPenColor (clbrown);
SetPenWidth(5);
Line(225,125,600,125);
Line(225,125,225,400);
Line(225,400,750,400);
Line(750,400,600,125);
floodfill (500,250, clblue);
end.
Равнобедренная трапеция

Program grey_7;
uses GraphABC;
begin
SetWindowWidth(750);
SetWindowHeight(700);
SetPenColor (clskyblue);
SetPenWidth(5);
Line(225,125,500,125);
Line(225,125,100,300);
Line(100,300,700,300);
Line(700,300,500,125);
floodfill (500,250, clred);
end.
Треугольник

Program _1;
uses GraphABC;
begin
SetWindowWidth(700);
SetWindowHeight(700);
SetPenColor (clred);
SetPenWidth(5);
Line(225,125,100,300);
Line(100,300,400,200);
Line(400,200,225,125);
floodfill (200,200, clblue);
end.
Равносторонний треугольник

Program _2;
uses GraphABC;
begin
SetWindowWidth(700);
SetWindowHeight(700);
SetPenColor (clblue);
SetPenWidth(5);
Line(225,175,150,300);
Line(150,300,300,300);
Line(300,300,225,175);
floodfill (225,280, clgreen);
end.
Равнобедренный треугольник

Program _3;
uses GraphABC;
begin
SetWindowWidth(700);
SetWindowHeight(700);
SetPenColor (clblack);
SetPenWidth(5);
Line(225,105,150,300);
Line(150,300,300,300);
Line(300,300,225,105);
floodfill (225,280, clyellow);
end.
Прямоугольный треугольник
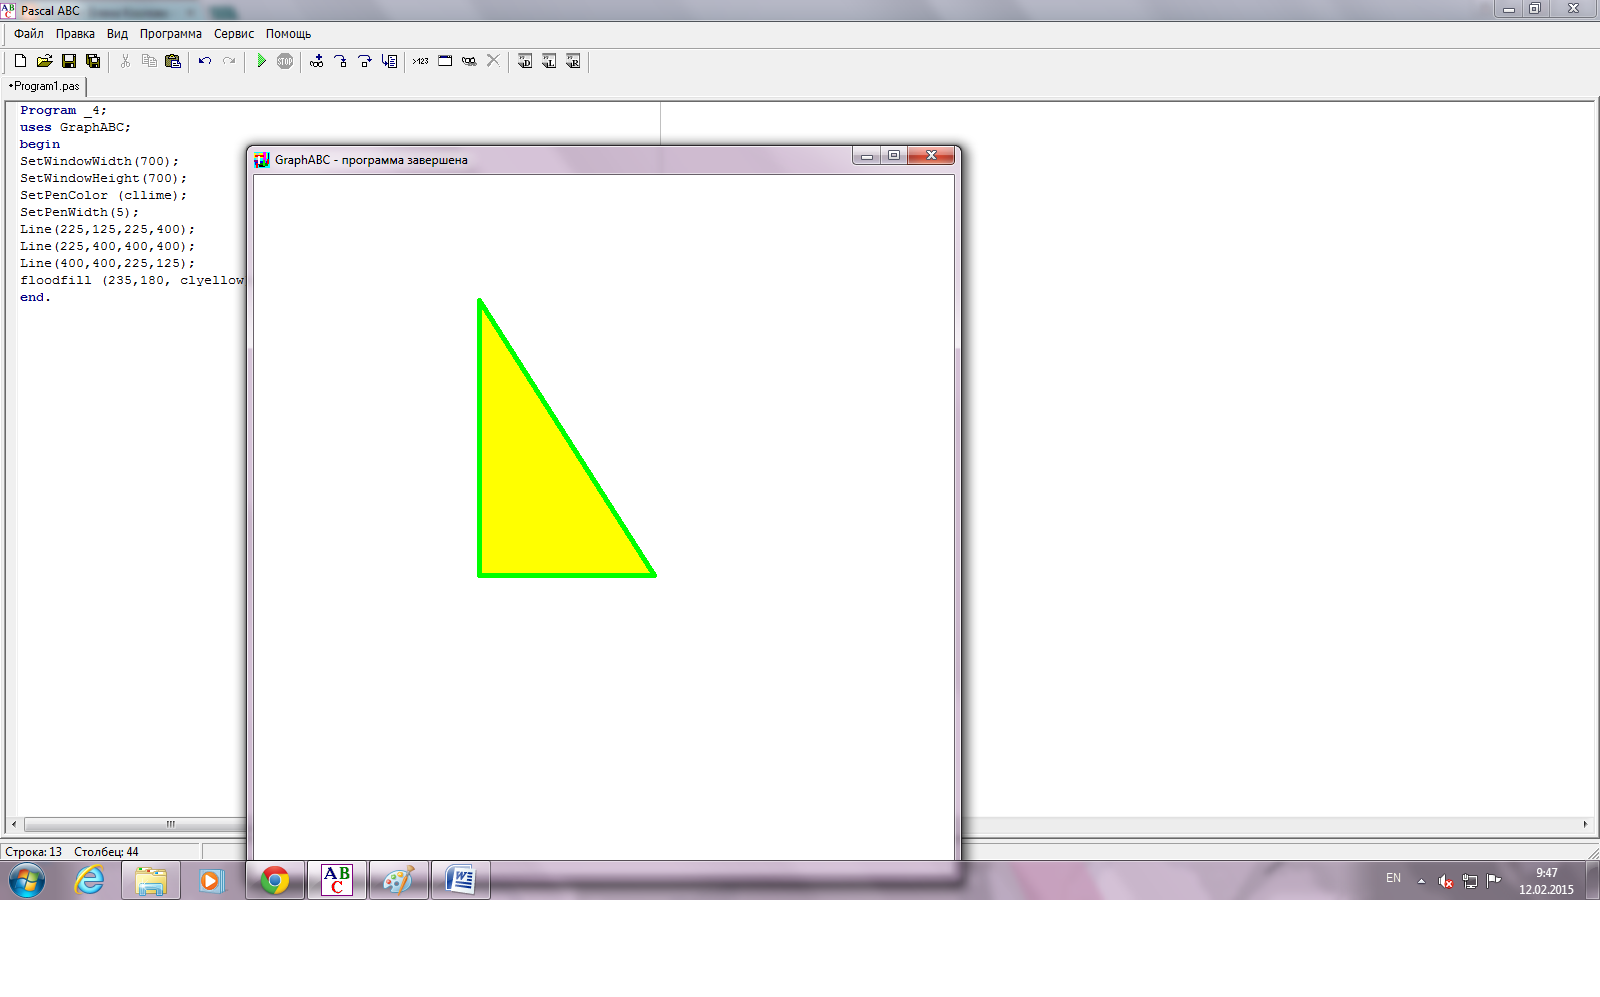
Program _4;
uses GraphABC;
begin
SetWindowWidth(700);
SetWindowHeight(700);
SetPenColor (cllime);
SetPenWidth(5);
Line(225,125,225,400);
Line(225,400,400,400);
Line(400,400,225,125);
floodfill (235,180, clyellow);
end.
Тупоугольный треугольник

Program _5;
uses GraphABC;
begin
SetWindowWidth(700);
SetWindowHeight(700);
SetPenColor (clgreen);
SetPenWidth(5);
Line(225,125,265,400);
Line(265,400,400,400);
Line(400,400,225,125);
floodfill (300,350, clskyblue);
end.
Астрономия(остальные фигурки размещу позже:они у меня есть, но флешку мама забрала)
1)
uses GraphABC;
Var earth, fon:integer;
Begin
SetWindowSize(800,800);
fon:=LoadPicture('SKY.GIF');
DrawPicture(fon,0,0,800,800);
earth:=LoadPicture('earth.gif');
DrawPicture(earth,180,150,500,500);
End.
2)Program astronomija;
Uses Crt, GraphABC;
 Var a,b,c,x:integer;
Begin
SetWindowSize(1000,500);
a:=LoadPicture('SKY.GIF');
b:=LoadPicture('earth.gif');
c:=LoadPicture('Sputnik.jpg');
SetPictureTransparent(c,true);
LockDrawing;
while x<1000 do
begin
inc(x,10);
DrawPicture(a,1,1,999,499);
DrawPicture(b,-150,250,1300,800);
DrawPicture(c,x,100,50,40);
redraw; sleep(20);
end;
End.
*движение планет вокруг Солнца по круговым орбитам.

program solnce;
uses crt,GraphABC;
var nebo,coln,zeml,pln,x0,y0,x,y,u,R:integer;
begin
SetWindowSize(250,250);
nebo:=LoadPicture('19595692.jpg');
coln:=LoadPicture('polet-na-mars.jpg');
zeml:=LoadPicture('zemljashar300 (1).jpg');
pln:=LoadPicture ('pluton.jpg');
x0:=75;y0:=55;

while u<=360 do
begin
ClearWindow;
DrawPicture(nebo,0,0);
DrawPicture(coln,70,60,30,30);
x:=round(x0+R*cos(pi*u/180));
y:=round(y0-R*sin(pi*u/180));
DrawPicture(zeml,x,y,10,10);
x:=round(x0+R*0.8*cos(pi*u/180));
y:=round(y0-R*0.8*sin(pi*u/180));
DrawPicture(pln,y,x,10,10);
u:=u+1;
sleep(10);
Redraw;
end;
end.
*Составьте программу, которая загружает из файлов и выводит на экран изображение нескольких планет Солнечной системы на фоне звездного неба.

uses crt,GraphABC;
var nebo,planeta:integer;
begin
SetWindowSize(1000,600);
nebo:=LoadPicture('19595692.jpg');
DrawPicture(nebo,10,10);
planeta:=LoadPicture('pluton.jpg');
SetPictureTransparent (planeta, true);
DrawPicture(planeta,100,60,120,120);
planeta:=LoadPicture('polet-na-mars.jpg');
SetPictureTransparent (planeta, true);
DrawPicture(planeta,400,300,100,100);
planeta:=LoadPicture('73.jpg');
SetPictureTransparent (planeta, true);
DrawPicture(planeta,500,50,120,100);
end.
*Составьте программу, которая демонстрирует увеличение изображения нескольких из планет Солнечной системы.
 program ooo;
uses crt,GraphABC;
var nebo,planeta,x,y,w,h :integer; k:real;
begin
SetWindowSize(1200,600);
nebo:=LoadPicture('19595692.jpg');
DrawPicture(nebo,0,0);
planeta:=LoadPicture('pluton.jpg');
SetPictureTransparent (planeta, true);
x:=0; y:=200;
w:=100; h:=100;
DrawPicture(planeta,x,y,w,h);
while w<2*100 do
begin
w:=w+10; h:=h+10; x:=x-5; y:=y-5;
DrawPicture(planeta,x,y,w,h);
sleep(20);
Redraw;
end;
planeta:=LoadPicture('polet-na-mars.jpg');
SetPictureTransparent (planeta, true);
x:=220; y:=200;
w:=150; h:=100;
DrawPicture(planeta,x,y,w,h);
while w<4*100 do
begin
w:=w+10; h:=h+10; x:=x-5; y:=y-5;
DrawPicture(planeta,x,y,w,h);
sleep(20);
Redraw;
end;
planeta:=LoadPicture('73.jpg');
SetPictureTransparent (planeta, true);
x:=600; y:=100;
w:=100; h:=120;
DrawPicture(planeta,x,y,w,h);
while w<3*100 do
begin
w:=w+10; h:=h+10; x:=x-5; y:=y-5;
DrawPicture(planeta,x,y,w,h);
sleep(20);
Redraw;
end;
end.
География
Составьте программу, которая:
выводит карту Беларуси и обозначает национальные парки и заповедники квадратами, размеры которых пропорциональны площади парка: Беловежская пуща, Нарочанский, Браславские озёра, Припятский, Березинский биосферный заповедник, Полесский государственный радиационно-экологический заповедник

program z1;
uses crt, GraphAbc;
const a: array [1..6] of real=(87.5, 71.5, 85.8, 97.3, 85.2, 131.3);
a1: array [1..6] of string =('Беловежская пуща', 'Браславские озёра', 'Припятский парк', 'Нарочанский парк','Березенский биосферный заповедник','Полесский государственный радиационно-экологический заповедник');
var i, x, karta: integer;
begin
setwindowsize (900,600);
writeln ('Площадь парков :');
karta:= loadpicture('belarus.gif');
drawpicture( karta,30,150);
setbrushcolor (clblue);
for i:=1 to 6 do
writeln (a1[i], ' тыс.га ',a[i]);
x:= round ((a[1]/6));
rectangle (80,460,80+x,460+x); { Беловежская пуща}
x:= round ((a[2]/6));
rectangle (230,190,230+x,190+x); { Браславские озёра}
x:= round ((a[3]/6));
rectangle (270,510,270+x,510+x); { Припятский парк}
x:= round ((a[4]/6));
rectangle (210,270,210+x,270+x); { Нарочанский парк }
x:= round ((a[1]/6));
rectangle (290,280,290+x,280+x); { Березенский биосферный заповедник }
x:= round ((a[1]/6));
rectangle (380,530,380+x,530+x); { Полесский государственный радиационно-экологический заповедник}
end.
*выводит карту Беларуси, строит таблицу с данными о площади и глубине озер, столбчатую, линейчатую диаграмму (столбчатая и линейная диаграммы в разных программах)
program d;
uses crt,GraphABC;
constA: array [1..10] of real=(79.6,52.8,40.3,37.71,36.1,26.0,24.6,22.3,22.0,16.2);
B:array[1..10] of real=(24.8,7.5,2.9,11.5,12.0,2.3,8.1,8.7,16.5,24.6);
C:array[1..10] of string=('Нарочь','Освейское','Червоное','Лукомльское','Дривяты','Выгонощанское','Нещердо','Свирь','Снуды','Мядель');
var karta,i,S:integer;
begin
SetWindowSize(650,500);
writeln('площадь и глубина озер Беларуси:');
karta:=LoadPicture('karta.gif');
DrawPicture(karta,340,0,250,200);
writeln('Озеро':15,'Площадь':13,'Глубина':9);
for i:=1 to 10 do
writeln(i,C[i]:15,' ',A[i]:7:2,' км.кв',B[i]:7:2,'м');
writeln;writeln;
writeln('Выберите вариант диаграммы:1-столбчатая,2-линейная');
read(S);
writeln;
SetPenWidth(5);
case S of
1:begin writeln('Столбчатая диаграмма');
for i:=1 to 10 do
begin
write(' ',i);
SetPenColor(clBlue);
Line(5+25*i,420-round(2*A[i]),5+25*i,420);
SetPenColor(clGreen);
Line(10+25*i,420-round(2*B[i]),10+25*i,420);
end;
end;
2:begin writeln('Линейчатая диаграмма');
for i:=1 to 10 do
begin
writeln(C[i]:15,' ');
SetPenColor(clRed);
Line(160,250+15*i,160+round(5*A[i]),250+15*i);
SetPenColor(clGreen);
Line(160,255+15*i,160+round(5*B[i]),255+15*i);
end;
end;
end;
end.
*выводит карту Европы и помечает страны (столицы 7 государств) символами, размеры которых пропорциональны численности населения.
program k;
uses crt,GraphABC;
const A: array[1..7] of real=(37.7,22.0,21.1,17.7,16.2,11.6,7.4);
B:array[1..7] of string=('Берлин','Варшава','Париж','Минск','Стокгольм','Хельсинки','Амстердам');
var karta,i,R:integer;
begin
SetWindowSize(700,700);
writeln('численность населения столиц государств');
karta:=LoadPicture('karta.gif');
DrawPicture(karta,0,200,700,500);
writeln('Столица':15,'Численность населения':13);
for i:=1 to 7 do
writeln(i,B[i]:15,' ',A[i]:7:1,' тыс.чел');
SetBrushColor(clBlue);
R:=round(sqrt(A[1]/pi));{Берлин}
circle(405,470,R);
R:=round(sqrt(A[2]/pi));{Варшава}
circle(510,465,R);
R:=round(sqrt(A[3]/pi));{Париж}
circle(250,520,R);
R:=round(sqrt(A[4]/pi));{Минск}
circle(580,440,R);
R:=round(sqrt(A[5]/pi));{Стокгольм}
circle(455,373,R);
R:=round(sqrt(A[6]/pi));{Хельсинки}
circle(530,350,R);
R:=round(sqrt(A[7]/pi));{Амстердам}
circle(290,475,R);
end.
Физика
Составьте программу, которая:
строит изображения предмета в плоском зеркале (расстояние от предмета до зеркала вводится с клавиатуры)
program h;
uses crt,GraphABC;
var pic,R:integer;
begin
SetWindowSize(800,500);
write('Ââåäèòå ðàññòîÿíèå îò ïðåäìåòà äî çåðêàëà(5-100):');
readln(R);
pic:=LoadPicture('robot.jpg');
SetPenColor(clBrown);
SetPenWidth(7);
line(320,50,320,400);
line(50,400,590,400);
DrawPicture(pic,320+R,100,200,290);
DrawPicture(pic,320-R,100,-200,290);
SetPenColor(clGray);
SetPenWidth(2);
line(trunc(120+R/2),100,trunc(520-R/2),100);
end.
*демонстрирует отражение и преломление света на плоской поверхности (угол падения вводится с клавиатуры).
program m;
uses crt,GraphABC;
var x,y,u:integer;
begin
SetWindowSize(500,500);
write('Ââåäèòå óãîë ïàäåíèÿ ëó÷à(5-85):');
readln(u);
SetPenColor(clGreen);
SetPenWidth(4);
line(150,50,150,350);
SetPenColor(clGray);
line(0,200,300,200);
SetPenColor(clRed);
x:=abs(round(150*sin(pi/180*(180-u))));
y:=abs(round(150*cos(pi/180*(180-u))));
line(150,200,150-x,200-y);
x:=round(150*sin(pi/180*u));
y:=round(150*cos(pi/180*u));
line(150,200,150+x,200-y);
SetPenColor(clYellow);
x:=abs(round(150*sin(pi/180*(270+u))));
y:=abs(round(150*cos(pi/180*(270+u))));
line(150,200,150+x,200+y);
end.
Биология
1)Program zagryazneniye;
Var N,P,i,t,u0:integer;u:real;
Begin
write('Введите уровень загрязнения воды ');
readln(u0);
write('Введите коэффициент уменьшения загрязнения воды ');
readln(N);
write('Введите значение уменьшения загрязнения воды ');
readln(P);
t:=0; u:=u0;
while u>u0 div N do
begin
u:=u-u*p/100;
t:=t+1;
end;
write('Через ',t,' дней');
End.
Треугольник
Program _6;
uses GraphABC;
 begin
beginSetWindowWidth(700);
SetWindowHeight(700);
SetPenColor (clgreen);
SetPenWidth(5);
Line(225,125,170,400);
Line(170,400,400,400);
Line(400,400,225,125);
floodfill (225,300, clred);
end.
Куб
Program _1;
uses GraphABC;
begin
SetWindowWidth(850);
SetWindowHeight(850);
SetPenColor (clblack);
SetPenWidth(5);
Line(400,150,800,150);
Line(400,150,300,250);
Line(300,250,700,250);
Line(700,250,800,150);
Line(300,250,300,650);
Line(700,250,700,650);
Line(800,150,800,550);
Line(800,550,700,650);
Line(700,650,300,650);
Pen.Style:=psDot;
Line(400,150,400,550);
Line(400,550,800,550);
Line(400,550,300,650);
floodfill (600,300,clorange);
floodfill (600,200,clorange);
floodfill (790,300,clorange);
end.
Параллелепипед
Program _2;
uses GraphABC;
begin
SetWindowWidth(850);
SetWindowHeight(950);
SetPenColor (clblue);
SetPenWidth(5);
Line(400,150,800,150);
Line(400,150,300,250);
Line(300,250,700,250);
Line(700,250,800,150);
Line(300,250,300,850);
Line(700,250,700,850);
Line(800,150,800,750);
Line(800,750,700,850);
Line(700,850,300,850);
Pen.Style:=psDot;
Line(400,150,400,750);
Line(400,750,800,750);
Line(400,750,300,850);
floodfill (600,300,clgreen);
floodfill (600,200,clgreen);
floodfill (790,300,clgreen);
end.
Призма
Program _3;
uses GraphABC;
begin
SetWindowWidth(850);
SetWindowHeight(850);
SetPenColor (clgold);
SetPenWidth(5);
Line(200,300,400,100);
Line(600,300,400,100);
Line(200,300,600,300);
Line(200,300,200,800);
Line(200,800,600,800);
Line(600,800,600,300);
Pen.Style:=psDot;
Line(400,100,400,600);
Line(400,600,200,800);
Line(400,600,600,800);
floodfill (500,400,clviolet);
floodfill (500,290,clviolet);
Program _4;
uses GraphABC;begin
SetWindowWidth(900);
SetWindowHeight(900);
SetPenColor (cldarkred);
SetPenWidth(5);
Line(300,100,600,100);
Line(600,100,450,300);
Line(450,300,300,100);
Line(300,100,500,600);
Line(450,300,650,800);
Line(600,100,800,600);
Line(500,600,650,800);
Line(650,800,800,600);
Pen.Style:=psDot;
Line(800,600,500,600);
floodfill (400,200,clcoral);
floodfill (700,700,clcoral);
floodfill (400,300,clcoral);
floodfill (500,300,clcoral);
end.
Program _5;
uses GraphABC;
begin
SetWindowWidth(850);
SetWindowHeight(950);
SetPenColor (clplum);
SetPenWidth(5);
Line(400,150,800,150);
Line(400,150,300,250);
Line(300,250,700,250);
Line(700,250,800,150);
Line(300,250,300,550);
Line(700,250,700,550);
Line(800,150,800,450);
Line(800,450,700,550);
Line(700,550,300,550);
Pen.Style:=psDot;
Line(400,150,400,450);
Line(400,450,800,450);
Line(400,450,300,550);
floodfill (600,300,cldarkmagenta);
floodfill (600,200,cldarkmagenta);
floodfill (790,300,cldarkmagenta);
end.
Program _6;
uses GraphABC;
begin
SetWindowWidth(850);
SetWindowHeight(950);
SetPenColor (clolive);
SetPenWidth(5);
Line(400,150,800,150);
Line(400,150,300,250);
Line(300,250,700,250);
Line(700,250,800,150);
Line(300,250,100,550);
Line(700,250,500,550);
Line(800,150,600,450);
Line(500,550,600,450);
Line(100,550,500,550);
Pen.Style:=psDot;
Line(400,150,200,450);
Line(200,450,600,450);
Line(200,450,100,550);
floodfill (600,300,clskyblue);
floodfill (600,200,clskyblue);
floodfill (750,210,clskyblue);
end.
Program _7;
uses GraphABC;
begin
SetWindowWidth(600);
SetWindowHeight(600);
SetPenColor (clnavy);
SetPenWidth(5);
Line(300,200,100,500);
Line(300,200,500,500);
Line(100,500,500,500);
Pen.Style:=psDot;
Line(300,200,300,400);
Line(100,500,300,400);
Line(500,500,300,400);
floodfill (200,490,clchocolate);
end.
Прямоугольная пирамида
Program _8;
uses GraphABC;
begin
SetWindowWidth(600);
SetWindowHeight(600);
SetPenColor (clcrimson);
SetPenWidth(5);
Line(300,100,200,400);
Line(300,100,400,400);
Line(300,100,450,350);
Line(200,400,400,400);
Line(400,400,450,350);
Pen.Style:=psDot;
Line(200,400,250,350);
Line(250,350,450,350);
Line(300,100,250,350);
floodfill (300,200,cllime);
floodfill (420,310,cllime);
end.
Program _9;
uses GraphABC;
begin
SetWindowWidth(600);
SetWindowHeight(600);
SetPenColor (clcyan);
SetPenWidth(5);
Line(250,150,200,400);
Line(300,100,400,100);
Line(250,150,350,150);
Line(200,400,400,400);
Line(400,400,450,350);
Line(350,150,400,400);
Line(400,100,450,350);
Line(350,150,400,100);
Line(250,150,300,100);
Pen.Style:=psDot;
Line(200,400,250,350);
Line(250,350,450,350);
Line(300,100,250,350);
floodfill (300,200,cltan);
floodfill (420,310,cltan);
floodfill (320,110,cltan);
end.
Program _10;
uses GraphABC;
begin
SetWindowWidth(600);
SetWindowHeight(600);
SetPenColor (clsilver);
SetPenWidth(5);
Line(200,200,100,500);
Line(400,200,500,500);
Line(100,500,500,500);
Line(300,100,200,200);
Line(300,100,400,200);
Line(200,200,400,200);
Pen.Style:=psDot;
Line(300,100,300,400);
Line(100,500,300,400);
Line(500,500,300,400);
floodfill (200,490,clyellow);
floodfill (290,190,clyellow);
end.
Program _11;
uses GraphABC;
Begin
SetWindowWidth(600);
SetWindowHeight(650);
SetPenwidth(5);
circle(300,400,200);
arc(300,150,300,228,312);
floodfill (300,300,clviolet);
floodfill (300,590,clviolet);
end.
График

var x0, y0, x1, y1, k: integer; x, y: real;
begin
SetWindowSize (640, 400);
x0:=320; y0:= 200; k:=20;
line (20, y0, 620, y0);
line (x0, 20, x0, 380);
SetPenColor (clRed);
x:=-12;
While x<=12 do
begin
y:=0.5 * x *cos(x);
x1:= trunc (x0 + x * k);
y1:=trunc (y0 + y * k);
circle (x1, y1, 2);
x:= x + 0.02;
end;
end.
y = sinx*cos 2x, на промежутке [-15; 15].

var x0, y0, x1, y1, k: integer; x, y: real;
begin
SetWindowSize (640, 400);
x0:=320; y0:= 200; k:=20;
line (20, y0, 620, y0);
line (x0, 20, x0, 380);
SetPenColor (clPurple);
x:=-15;
While x<=15 do
begin
y:=sin(x)*cos(2*x);
x1:= trunc (x0 + x * k);
y1:=trunc (y0 + y * k);
circle (x1, y1, 2);
x:= x + 0.02;
end;
end.
3. Составить программу, которая строит круговую диаграмму, иллюстрирующая:
распределение результатов тестирования по трем предметам
program t;
uses crt, GraphABC;
const D: array [1..3] of string = ('Белорусский язык','Немецкий язык','История Беларуси');
var a,b,c,a1,b1,c1,S:integer;
begin
SetWindowsize (640,400);
write('Введите результаты первого теста:80 '); readln(b);
write('Введите результаты второго теста:95 '); readln(a);
write('Введите результаты третьего теста:75 '); readln(c);
S:=a+b+c;
a1:=round(a*360/S);
SetBrushColor(clYellow);
Pie(220,240,140,0,a1);
b1:=a1+round(a*360/S);
SetBrushColor(clGreen);
Pie(220,240,140,a1,b1);
c1:=b1+round(a*360/S);
SetBrushColor(clBlue);
Pie(220,240,140,b1,c1);
end.
химический состав земной кары: кислород – 47,2%, кремний – 27,6%, алюминий – 8,3%, железо – 5,1%, кальций – 3,6%, другие элементы- 8,2%.

program j;
uses crt, GraphABC;
const A: array [1..6] of real = (47.2, 27.6, 8.3, 5.1, 3.6, 8.2);
B: array [1..6] of string = ('Кислород', 'Кремний', 'Алюминий', 'Железо', 'Кальций', 'Другие элементы');
var s: real;
var u, u0, i: integer;
begin
SetWindowSize (400, 400);
s:=0; u0:=0;
for i:= 1 to 6 do S:= S + A [I];
for i:=1 to 6 do
begin
Writeln (B [ i ], ' ', A [ i ], '%', round (100 * A [ i ] / S ), '\\' );SetBrushColor (rgb (random (255), random (255), random (255)));
u:=u0 + round(A[ i] * 360 / S);
Pie (220, 240, 140, u0, u);
u0:=u;
end;
end.
Комментариев нет:
Отправить комментарий